

Chapter 3 - Apandemia - Part 2
By Stefano Scoglio - translated to English from Italian

As I mentioned earlier, Chapter 3 is very long, so I’m breaking it into sections. Even so, each part still feels quite lengthy. However, if I make them too short, I’ll end up posting this book’s translation for years. I’d like to complete it relatively quickly, in case something else comes up.
The book was published on December 14, 2021, shortly before the Freedom Convoy took place in Ottawa in January 2022.
The publisher is Poliphylia.1 It is still available for sale on the Poliphylia website for €26.60 (approximately 42.87 Canadian dollars). The book is also listed on Amazon, where it has 62 reviews and a 4.7-star rating. One reviewer wrote: “A clear and lucid treatment. A book rich in scientific data supporting the topics discussed. Demanding, precise, and professional reading.”2
FIRST QUARTER 2020: EXCEPTIONAL MORTALITY?
The stubborn pandemist might insist, claiming that anyway, if we consider the entire quarter or just the month of March, this exceptional mortality would be confirmed. On the other hand, ISTAT/ISS told us that for March alone there was a 49.4% increase, and this is in fact the highest number of all, the one that made the front pages of newspapers.
Since ISTAT/ISS give us only the percentage without any supporting numbers, and thus without any possibility of direct verification (and the lack of verifiability makes the ISTAT/ISS report an anti-scientific document), we have to continue reconstructing...
We have the number for the period February 20–March 31: to get the specific number of deaths for March 2020 alone, we must subtract the share of the 10 days of February. In doing this operation, we will also discover the data for February and January 2020, and thus the approximate total for the first quarter of 2020. ISTAT President Blangiardo, in his recent report, writes:
“The sharp rise in mortality from March onward occurred, moreover, during a year that had started with excellent prospects—the comparison of the first two months of 2020 with the same period in 2019 shows, in the 5,069 municipalities mentioned, a reduction of 8% from January 1 to February 2 and 9% from February 3 to 29.”
The deaths in January and February 2019 were, according to ISTAT data, respectively 68,209 (and already here we would have a month even closer to the number of March 2020 deaths) and 59,876. To estimate the number of deaths in the first two months of 2020 based on these 2019 data, we add the two numbers and then apply an average reduction of 8.5% (average of 8% and 9%), obtaining:
68,209 + 59,876 = 128,085 128,085 - 8.5% = 117,197
These are the approximate deaths for the first two months of 2020.
To establish the specific number for March, we must subtract from the figure of 90,946, which refers to the period 20-2/31-3 2020, the share relating to the last 10 days of February: from the February number, 59,876, we subtract 9%, divide by 29 days of February, multiply by 10 (the last 10 days included in the ISTAT number for the period of February 20th to March 31st), and obtain:
59,876 - 9% = 54,487.16 54,487.16 / 28 x 10 = 19,459
19,459 is the number of deaths in the period February 20–29, 2020. Subtracting this number from the ISTAT total of 90,946 for the period 20-2/31-3, we get:
90,946 - 19,459 = 71,487
The very probable figure for March 2020 deaths is 71,487. Adding this figure to that of the first two months’ deaths, we have: 117,197 + 71,487 = 188,684
Thus, the total deaths in Italy for the first quarter of 2020 is about 188,684. And in the same period in previous years? According to ISTAT data, these are the numbers for the first quarters of the previous 5 years:
2019 - 185,967
2018 - 184,991
2017 - 192,045
2016 - 166,965
2015 - 188,072
As can be seen, the number of deaths in the first three months of 2020 is substantially identical to that of 2015, and even lower than the first quarter of 2017! Therefore, first-quarter 2020 deaths are absolutely within normal annual variations; there is no pandemic mortality!
MARCH 2020: EXCEPTIONAL MORTALITY?
And March 2020, the fulcrum of the “worst pandemic since World War II,” presumably overwhelmed by an unprecedented number of deaths? The figure, as we saw, is about 71,487, and this should be the figure that ISTAT/ISS told us was 49.4% higher than the average March deaths of the previous 5 years. Let’s see if it’s true. These are the March deaths of the 5 years prior to 2020:
2015 - 61,581
2016 - 56,401
2017 - 58,198
2018 - 58,593
2019 - 57,882
=292,655
Average March months 2015-2019 = 292,655 / 5 = 58,531
Excess March 2020 deaths compared to average March of previous 5 years:
71,487 / 58,531 = 1.22 = +22%
The increase compared to the average is thus only 22%... less than half of that 49.4% trumpeted by ISTAT/ISS and then by the media! But the truth is that this number can only be obtained by comparing March 2020 with the average of the previous 5 March months, because, as we know, the average gives a lower result, and thus this year’s number can make a better showing (so to speak). But if we take, for example, the number of deaths in March 2015, when there were 61,581 deaths, the ratio drops to:
71,487 / 61,581 = 1.16 = +16%.
The stubborn pandemist would cling to this number anyway, claiming that March 2020 was the March with the highest mortality compared to all previous Marches. True, 16%, a percentage not too dignified for the worst pandemic of the last century.
Above all, it must be considered that March 2020 was a very particular March, the true winter month of the season: January and the first half of February 2020 had spring-like weather, and winter began at the end of February and throughout March. To understand how this 16% increase is completely normal, just think that, as we saw and as confirmed by ISTAT President Blangiardo, January had 9% lower mortality and February 8% lower: the 16% more in March is nothing but compensation for the 17% (9%+8%) lower mortality in the first two months of the year. Thus, there was in fact only a shift of winter to March, with the typical increase in mortality of the winter season.
This is why it is plausible that this year’s March, compared to previous Marches, turns out to have more deaths, always among those very sick elderly who generally succumb precisely in the flu season. And this is why the comparison must be extended to all winter months of previous years, otherwise there is a risk of passing off a simple seasonal change as a pandemic!
And indeed, to demonstrate that the number of deaths in March 2020 is absolutely exceptional and thus potentially pandemic, its mortality must be far higher than any other month, not just Marches. And we have already seen how in January 2019, just over a year ago, there were 68,209 deaths: here the difference with March 2020 would be just +4.8%, a trifle.
And finally, in January 2017 as many as 75,623 people died! January 2017 - 75,623 deaths; March 2020 - 71,487 deaths = 1.057
That is, in January 2017 there were nearly 6% more deaths than in March 2020, but no one dreamed of talking about a pandemic or shutting down the entire nation for months!
In other words, March 2020 had more deaths than previous Marches only because this year the flu season was very late, with January and February warm (and indeed with fewer deaths than usual), and it occurred in March, hitting as always only very elderly and sick people. And it is therefore evident that ISTAT, by choosing a misaligned period in comparison with previous years, focusing only on one month, and often making calculation errors (?) or obscuring the numbers, clearly tried to inflate a pandemic that, neither in the calculation of the first three months nor in the comparison of March 2020, actually existed.
FEW EX-COVID-19 DEATHS, ONLY IN THE NORTH
At this point we can proceed to dismantle the entire framework of the ISTAT/ISS report, where it states:
“The excess deaths are 25,354 units, of these 54% is made up of deaths diagnosed COVID-19 (13,710).”
We have already seen how these numbers are falsified by the wrong calculation of the 2015-2019 average, which is actually 79,172; with the difference reducing to: 90,946 - 79,172 = 11,774 more deaths in the period of February 20th to March 31st of 2020 compared to the same period the previous year. Only 54% of these, says ISTAT/ISS, is attributable to COVID-19, thus: 6,357 ex-COVID-19 deaths in the peak period of the most terrible pandemic ever remembered, 0.010% of the Italian population. But it doesn’t end there. ISTAT adds:
“In 34.7% of reported cases, at least one comorbidity is reported (one among: cardiovascular diseases, respiratory diseases, diabetes, immune deficiencies, metabolic diseases, oncological diseases, obesity, renal diseases or other chronic diseases).”
Apart from not understanding how it was possible to go from the 97% of cases with serious concomitant pathologies initially established by ISS to a much lower 34% (what happened in the second half of the period, did only young healthy people die?); even accepting the 34% figure for serious comorbidities, this 34% should be eliminated from confirmed COVID-19 cases, and thus we would drop to 4,195 deaths from COVID-19 in the most terrible pandemic period from February 20 to March 31; 0.0069% of the Italian population.
We are obviously talking about trifles, given that the average number of monthly deaths in Italy in the winter period is about 60,000, and for the period in question, which adds another 1/3 of a month, would be as much as 80,000, of which thus only a little over 4,000 would be due to COVID-19. And this would be the pandemic?
There is also a further aspect that denies the existence of a pandemic. ISTAT writes:
“91% of the excess mortality found at the national average level in March 2020 is concentrated in high-diffusion epidemic areas: 3,271 municipalities, 37 Northern provinces plus Pesaro and Urbino... If the period from February 20 to March 31 is considered, deaths went from 26,218 to 49,351 (+23,133); a little more than half of this increase (52%) consists of deaths reported to the Integrated COVID-19 Surveillance System (12,156).”
We have shown above how these are clearly inflated numbers. Here we are told that 91% of these deaths are in the 37 Northern provinces + Pesaro-Urbino. This means that the true number of deaths attributable to COVID-19 in these 38 provinces would be not 12,156, but just 3,817 (4,195 x 91%). ISTAT adds:
“In medium-diffusion epidemic areas (1,778 municipalities, 35 provinces mainly in Central-North), the increase in deaths for all causes combined in the period February 20–March 31 is much more contained, from 17,317 to 19,743 (2,426 more than the 2015-2019 average); 47% is attributable to deaths testing positive for COVID-19 (1,151).”
Thus, in the other 35 Central-Northern provinces there would be only 1,151 coronavirus deaths. Even here, if we correct based on the reduction from +25,354 to +11,680 excess cases, we would have just 529 deaths! Further purged of the 34% of cases with serious concomitant pathologies, that would give only 349 COVID-19 deaths! And finally,
“...in low-diffusion areas (1,817 municipalities, 34 provinces mostly in the Center and South), March 2020 deaths are on average 1.8% lower than the previous five-year average.”
In the last third of the provinces, March deaths this year actually decreased, even if only by 1.8%: a further methodological flaw, since the analyses of the previous two provincial groups refer to the period of February 20th to March 31st, while this one on Southern provinces refers only to the month of March. And since this data, going against the narrative of the terrible pandemic, is of no interest to ISTAT—in fact, it must be minimized—here too ISTAT does not tell us what numbers that -1.8% percentage corresponds to!
Thus, there would have been an increase of 3,817 deaths in the North; 349 in Central-North; and even a 1.8% reduction in the South. Whatever the real number of this 1.8% is, it is surely more than enough to more than compensate for the Central-North figure, which is therefore canceled out in the excess deaths count.
It follows, from the appropriately reprocessed ISTAT data, that there were only 3,817 COVID-19 deaths in Italy (in my opinion not even that many), and practically all in the North, while in 2/3 of Italy NOTHING HAPPENED!!! Someone needs to explain to me how it can be a pandemic when 2/3 of a country are completely spared from any increase in mortality! And above all, someone should explain the reason for shutting down an entire nation for months for a few thousand deaths, equal to the normal deaths in a couple of days, and all concentrated only in 1/3 of the nation itself.
The truth is that, even assuming the ISTAT numbers for the period they presented are real (and they are not), we would have 12,156 deaths (which should at least be purged of the 34% of deaths with other serious concomitant pathologies; but never mind).
Is this an exceptional number? If we project the number of deaths from the 41 days of February 20th to March 31st onto a 3-month period (90 days), we get:
12,156 / 41 days x 90 days = 26,676
According to ISTAT, there would have been about 26,676 deaths caused by COVID-19 in this year’s first quarter. We have seen that this is not true, but even if it were, would it be an exceptional number? Epidemiologist Stefano Petti, professor at La Sapienza, writes:
“The trend in Italian mortality is by no means regular; it follows periodic peaks—never explained, moreover—at intervals of about 2-4 years. For example, in the winter of 2015, from January to March, 217,000 premature deaths occurred in Europe among those over 65 and only 9,000 distributed in other age groups, only partially attributed to flu. Italy paid the highest price that year: 45,000 deaths in just three months (Michelozzi et al, 2016).”
Thus, in 2015 for respiratory pathologies, 45,000 excess deaths occurred in the three months from January to March, almost double those now attributed to COVID-19 (26,676) by ISTAT/ISS for the same 2020 period. Further proof that this year’s mortality, including that attributed to COVID-19, is absolutely within normal periodic variation levels.
STRANGE DEATHS IN THE HARDEST-HIT CITIES
From the ISTAT document emerges another interesting datum, which should stimulate more specific research and raises not a few questions that health and political authorities should answer. When ISTAT deals with the individual hardest-hit cities, this is what emerges:
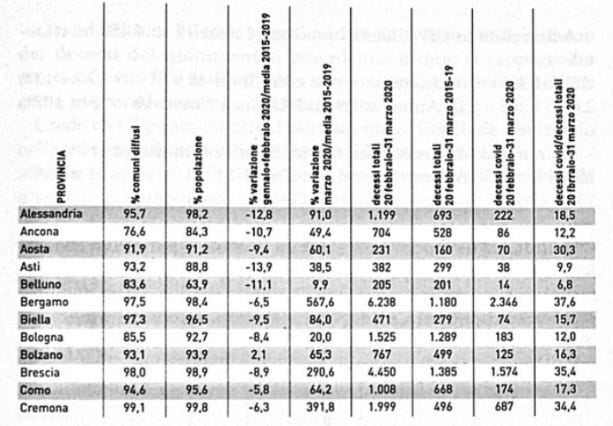
In the province of Bergamo there would have been a 567% increase in mortality, an enormous number. In concrete terms, deaths went from 1,180 (average March deaths over the previous 5 years) to 6,238 in March 2020, an exceptional jump (even if limited to one city). But if we look closer, we see that of these 6,238 deaths, only 2,346 are attributed to COVID-19, meaning that the vast majority of deaths, nearly 4,000, 2/3, are due to something other than COVID-19, and to a large extent. The effective mortality increases would be as follows:
2,346 : 1,180 = 1.98 Increase in deaths WITH COVID-19 = +98%
3,892 : 1,180 = 3.29 Increase in deaths NOT WITH COVID-19 = +229%
The real problem of Italian mortality in these months of the alleged pandemic appears overwhelmingly to be something other than COVID-19!
And it’s not an isolated case; the same thing happens in other affected cities:
In Brescia, only 1,574 deaths WITH COVID-19 out of 4,450 total deaths:
1,574 : 1,385 = 1.13 Increase in deaths WITH COVID-19 = +13%
2,876 : 1,385 = 2.07 Increase in deaths NOT WITH COVID-19 = +107%
In Cremona, 687 deaths WITH COVID-19 out of 1,999 total deaths:
687 : 496 = 1.38 Increase in deaths WITH COVID-19 = +38%
1,312 : 496 = 2.64 Increase in deaths NOT WITH COVID-19 = +164%
Thus, even where there was a significant excess mortality (but only for a limited period, offset by reductions in previous and subsequent months), this seems due to other causes besides COVID-19.
Let’s look at another ISTAT data screen:
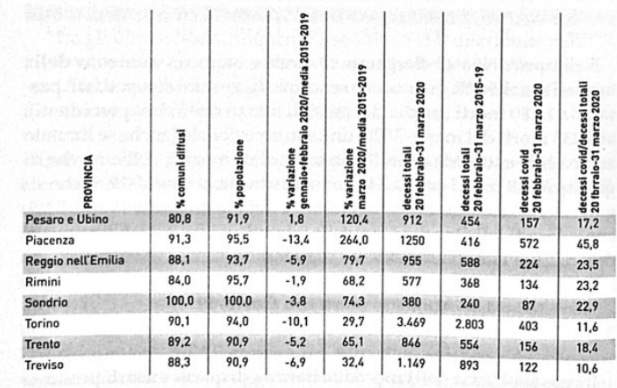
We see Turin, with 403 deaths WITH COVID out of 3,469 deaths:
403 : 2,803 = 0.14 Ratio of deaths WITH COVID-19 = -6%
3,066 : 2,803 = 1.09 Increase in deaths NOT WITH COVID-19 = +9%
Here, 2020 COVID-19 deaths are even 86% lower than in the previous five-year period; while the ratio between deaths FROM COVID-19 and deaths from other mysterious causes is no longer 1:2 as before, but fully 1:10!
I think the point is now more than clear. To conclude, returning to my homeland, the province of Pesaro-Urbino.
In Pesaro-Urbino province, out of 912 deaths (double the previous years’ average of 454), only 157 are WITH COVID-19:
157 : 454 = 0.34 Ratio of deaths WITH COVID-19 = -66%
755 : 454 = 1.66 Increase in deaths NOT WITH COVID-19 = +66%
In Pesaro-Urbino, if it had been only COVID-19, there would have been a 66% reduction in deaths; and it is only due to the +66% in deaths NOT WITH COVID-19 (755 deaths) that there is a doubling of total deaths. While the ratio between ex-COVID-19 deaths and other deaths is 1:5!
And as final and definitive proof of the non-existence of the pandemic, I return to my city of Urbino, included in the high-diffusion pandemic zone, as Pesaro-Urbino province is the only Central one added to the 37 high-mortality Northern ones. Well, do you know what the death ratio was in Urbino in 2020 compared to 2019?
Deaths first quarter (January 1–April 4):
2020 - 58
2019 - 70
That is, there was a significant reduction in the number of deaths.
RESPONSES TO SOME OBJECTIONS
Despite thousands of shares of this text of mine, there have been only a few objections, all relatively marginal, apart from a couple of small but useful corrections on a couple of minor numerical errors (which have been corrected in this version). I discuss the three main ones here:
a) “But we must evaluate the impact of the lockdown in reducing the number of deaths”: in reality, the lockdown started on March 11, 2020, i.e., already 21 days after the start of the period considered (February 20, 2020). Moreover, according to the dominant narrative, the virus has an incubation period of 14 days, so lockdown effects would not have been seen before two weeks from its start, i.e., not before March 25, almost at the end of the period considered by ISTAT (February 20–March 31, 2020). Thus, the first cases of virus presence in Italy were reported around February 6, 2020, and deaths start on February 20. Similarly, in the two weeks after the lockdown start, there would still have been deaths from infections up to March 10, 2020. In other words, if the lockdown had an impact (which is doubtful, since there was no mortality difference between Italy and countries that did not lockdown), it would have affected only 5-6 days out of 41, i.e., at most 12%, a percentage very likely more than offset by increased deaths due to lockdown (suicides, violence, and domestic accidents).
b) “But all the doctors who died from COVID-19?”
The issue of frontline doctors’ deaths is in fact one of the basic themes of the epidemiological narrative: without an abundant mortality of frontline doctors against the pandemic, what kind of pandemic would it be? And indeed, the WHO and media narrative has always emphasized the deaths of “infected” doctors. People accept this data as incontrovertible truth, as if until the coronavirus doctors didn’t die, as if they were immortal... I always say to look at the real numbers: in Italy, as of March 2020, there are 403,454 doctors registered with the order; this number represents 6.7/1,000 of the population, i.e., 6.7 doctors per thousand inhabitants.
Now, in Italy about 650,000 people die each year, from all social classes, and it is normal to expect that for every 1,000 of those deaths, 6 are doctors (we round down, maybe not all practice, although with the coronavirus emergency many were called back to service). This leads to about 3,900 doctors dying each year... That is, on average 3,900 doctors die in Italy every year, 325 per month... and you tell me that 94 or even 150 doctors dead “with” coronavirus is an emergency? If there had been 1,500 in a month, then yes there would have been something strange; instead here too it’s just media hype... Not to mention that most of these dead doctors were often retired and very advanced in age. The President of the Order of Doctors, in an interview where he was challenged that the list of deaths published on their site included all types of deaths and not only those from COVID-19, replied that in fact they just wanted to honor all their dead, and not only those from COVID-19. Yeah, right...
c) Finally, a statistical objection that gave me some headache: “But the 2020 data refer only to 86% of the population, while those from previous years [are for] 100%!” It seemed a sensible objection, so I looked into it, discovering why ISTAT reports data only for 86% of the 2020 population.
At the end of its report, ISTAT clarifies why it gave numbers relating only to 6,866 municipalities, equal to 87% of the total 7,904 Italian municipalities, and equal to 86% of the Italian population. The 1,038 missing municipalities were excluded not because there was no data, but because in those municipalities mortality in the 2020 period had decreased significantly compared to previous years! ISTAT writes:
“In light of these analyses, Istat deemed it appropriate not to disseminate data for 1,038 municipalities for which the decline recorded in 2020 is probably attributable to an incomplete or untimely flow of data notifications from the Municipality to the ANPR system or to Istat.”
Thus ISTAT eliminated all municipalities where there had been a significant reduction in mortality, on the pretext that they must be incomplete! That is, if they are not as we say, the data must be wrong! Therefore, the data calculated on 86% of the population are much more favorable to the hypothesis of a mortality increase in the 2020 period than the truth would be if all Italian municipalities had been included. From this point of view, my analysis of the ISTAT report is actually even too “kind,” and thus the substance of my argument remains confirmed.
https://www.lafeltrinelli.it/apandemia-dalla-falsa-scienza-alla-libro-stefano-scoglio/e/9791280828002?inventoryId=234744600
https://www.amazon.ca/Apandemia-scienza-grande-truffa-storia/dp/B09LGWWRX4#averageCustomerReviewsAnchor
There's a lot of statistics there. I'm glad you broke it up into sections. We had a number of young healthy doctors succumb to the vaccine. I don't know if they ever had covid.
Leslie
Interesting the part with doctor mortality. There is no occupational all cause mortalty data pre 2020 for Scotland as i tried to gather this. But i did manage to find how many 'front-line' workers ''succumbed to COVID.''
''not a single GP in Scotland died 'involving' COVID-19 in 2020.''
See-No COVID deaths in doctors section
https://biologyphenom.substack.com/p/scottish-covid-19-inquiry-impact-20e?utm_source=publication-search