

Chapter 3 - Apandemia - Part 1
By Stefano Scoglio - translated to English from Italian

Chapter 3 is very long, so I’m dividing it into parts. It contains a lot of math, too—a subject not everyone’s favorite but essential to dispelling the myth of a pandemic.
A LITTLE BACKGROUND:
The book is for sale on Amazon, with 62 reviews and a 4.7-star rating. One reviewer noted: “An essential text to know the other side of the coin of an influence-ridden by unscrupulous businessmen.”
“Apandemia: Dalla falsa scienza alla più grande truffa della storia” (NON-Pandemic: From False Science to the Biggest Fraud in History) by Stefano Scoglio was published in 2021. The book—arguing against the existence of SARS-CoV-2 and the validity of the pandemic—first appeared in early 2021, with related articles (e.g., “Phantom Virus: In search of Sars-CoV-2”) dating back to January 31, 2021.
Epidemiology of an Invented Pandemic: The Italian Data.
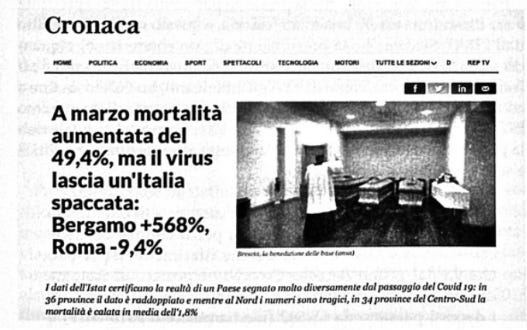
THE ISTAT MORTALITY REPORT February 20th to March 31st of 2020 - FROM MAY 13, 2020
Major newspapers, as well as all promoters of panic, are exalting the new ISTAT data on national mortality in the central period of the alleged pandemic, the month of March 2020 plus one third of February 2020. Take La Repubblica: “Even if tempered by the distinction between North and South, there remains the data of a national mortality, at least as it is presented to us, higher than the past by almost 50%.”
And this is the data that everyone cites as the definitive refutation of those, like the undersigned, who raise doubts about the reality of the facts of this pandemic. This is the comment on the Repubblica article by an “affirmativist” university professor:
“As was legitimate and logical to expect, the impact of COVID-19 has unfortunately manifested itself in a significant way, demonstrating, if there was need, that the pandemic IS NOT a fantasy; that behind COVID-19 there IS NO media conspiracy, but at most bad information; that as for all highly contagious diseases there IS a concrete risk of resumption... Let’s remember these obvious facts because if already now the front of the deniers claims that there had been no increase in deaths correlatable to the pandemic, imagine what they will invent tomorrow when the vaccine might be available!... It will already be difficult to live with the economic crisis... let’s at least avoid the circus of foolishness!”
In short, my idea that the alleged pandemic is only alleged and is now demonstrated to be mere foolishness, and this would be guaranteed by ISTAT. Since I presume not to be foolish, and when I hear ISTAT or any other government institution I smell a rat (I smell rat, as Americans say), I wanted to check, and what follows is what I found. The ISTAT document (”Impact of the COVID-19 epidemic on the total mortality of the resident population”) starts with this apodictic statement without possibility of discussion:
“Considering the month of March, a growth in deaths for all causes combined of 49.4% is observed at the national average level. If the period from the first COVID-19 death reported to the Integrated Surveillance System (February 20) to March 31 is taken as reference, deaths go from 65,592 (2015-2019 period average) to 90,946 in 2020. The excess deaths are 25,354 units, of these the 54% is made up of deaths diagnosed COVID-19 (13,710).”
It should immediately be noted that the reference to mortality concerns the “totality of causes” and not just the coronavirus. Therefore, the figure of 49.4% should not even be attributed to Covid-19; one should also ask what accounts for the other half of the supposed increase in mortality — a question that ISTAT carefully avoids posing.
One would expect ISTAT, in addition to providing percentages, to also give the specific numbers behind this national average increase. Instead, it just throws out this March statistic without any numerical support, and then moves straight on to discussing a different period — from February 20 to March 31 — a period that has the great advantage (for ISTAT and the regime media; disadvantage for us) of not being directly comparable, since for previous years no statistics exist for that same time frame. Already here, one can sense the intention to exaggerate without allowing verification.

Now, ISTAT tells us that from February 20 to March 31, deaths rose from an average of 65,592 in the years 2015–2019 to 90,946 in the same period of 2020. This represents an increase in deaths of 38.6%, not 49.4%: 90,946 ÷ 65,592 = 1.386 = +38.6%. And so, when actual numbers are given — not just abstract percentages — we already drop by almost 11 points; and 54% of that 38.6% yields the figure of 20.8%, presumably attributable to Covid.
Unfortunately, as I said, this number is not directly verifiable, because available statistics from previous years are monthly, not relative to a period of 1 month + 1/3 of a month. However, an indirect verification can be done, reliable even if not exactly precise, by reconstructing the ISTAT data. Here we see some ISTAT tables used for the comparison, starting from 2015 (http://demo.istat.it/bilmen-s2015gen/index.html):


The real data in the comparison February 20th to March 31st of 2020 with the average of the periods 2015-2019.
To verify this data, one must take the mortality statistics from previous years year by year; take the months of March (for which the data is available); take the February 2015-2019 numbers, which are available, divide them by 28 days, and multiply the result by the 10 days that make up the period 20-29 February 2020. In this way, we will have the data, for each previous year, of the same period calculated by ISTAT/ISS, and which according to them would give an average of 65,592. The data are taken from the demo.istat.it site, so they are ISTAT’s own official data.
Average March plus 1/3 February 2015-2019
2015 March = 61,581
February = 61,177 / 28 x 10 = 21,848
March + 10 days February 2015 = 61,581 + 21,848 = 83,429
2016 March = 56,401
February = 54,890 / 28 x 10 = 19,603 56,410 + 19,603 = 74,004
2017 March = 58,198
February = 58,224 / 28 x 10 = 20,794 58,198 + 20,794 = 78,992
2018 March = 58,893
February = 56,783 / 28 x 10 = 20,279 58,893 + 20,279 = 79,172
2019 March = 57,882
February = 59,876 / 28 x 10 = 21,384 57,882 + 21,384 = 79,226
Average March + 10 days of February 2015-2019
83,429 + 74,004 + 78,992 + 79,172 + 79,226 = 394,823 / 5 = 78,964
Good heavens! What’s this? ISTAT/ISS got the calculations wrong (unless one wants to think worse), and the true excess mortality ratio for the period February 20th to March 31st of 2020 compared to the average for the same periods of the previous 5 years is actually not +38.6%, but:
90,946 / 78,964 = 1.15 = +15%
An increase of which only 54% is attributed to COVID: namely, just 8.1%! An increase yes, but negligible compared to what was trumpeted, and unworthy of a true pandemic!
That this is the exact count is also evident from other data reported in the ISTAT/ISS Report. When ISTAT reports data for Italian provinces, divided into three groups “high diffusion” (38 provinces), “medium diffusion” (35 provinces), and “low diffusion” (34 provinces), it also reports the percentages of COVID-19 deaths out of total deaths in the period February 20th to March 31st of 2020. With the appropriate calculations, it turns out that in the 38 most affected Northern provinces, the percentage of deaths out of the total attributed to COVID-19 is 20.7%; in the 35 intermediate provinces it is 5.15%; in the 34 low diffusion ones, the percentage of COVID-19 deaths out of the total is just 1.38%.
Here we immediately note how in Central-Southern Italy, COVID-19 had an absolutely negligible impact; and even in the North, which would have been devastated by the pandemic, only 1 in 5 deaths was attributed to COVID-19. If we take the average of the percentages, weighted by the different number of provinces, we get a national average percentage of COVID-19 deaths out of total deaths of 9.56%. In other words, in Italy, according to ISTAT itself, fewer than 1 in 10 deaths is attributable to COVID-19 (without considering that in this 9.56% the vast majority, as we will see, are deaths with other serious concomitant pathologies).
Now, if we consider that COVID-19 deaths are, according to ISTAT, 54% of the total excess deaths, to find the entire excess deaths: we can multiply the 9.56% figure x 1.46 (thus adding the 46% of non-COVID deaths according to ISTAT) = 13.95%; or 14%, almost equal to that 15% we reported above as excess compared to the average for the same period in previous years. We arrived at the same result obtained by recalculating year by year, taking the percentage of COVID-19 deaths out of the total from the provincial data from ISTAT, 9.56%; and adding the missing 46% to the 54% of deaths attributed to COVID-19. In this way, the increase rate compared to the average of previous years is 14%; and that 14% of the total deaths in the period, 90,946, is 12,732; if we subtract this number from 90,946 we get 79,777, a number very close to the one we found by another route.
Think of the poor ISTAT statisticians; under enormous pressure from politicians and their scientific advisors, who must justify the destruction of the entire national economy, if they had come out stating that the increase in mortality in the already central period of the alleged pandemic had caused a 14% increase in deaths compared to the average of the previous 5 years. And what kind of pandemic is it with just 14% more deaths than the average? Under such pressure, it’s easy to make mistakes... ISTAT gives slightly different general numbers, namely: in the 38 high-intensity provinces, the COVID deaths/total deaths ratio is 24.6%; in medium-intensity ones 5.8%; in low-intensity 1.8%. I personally wanted to double-check by averaging all provincial percentages province by province, and the result is only slightly different: 20.7%; 5.15%; 1.38%.
And at this point: but if the comparison with the average gives me a difference of only 14-15%, then it’s likely that there are individual years where the difference is even smaller. And indeed, if we compare the deaths in that strange 2020 period with those in the same period in 2015:
90,946 (2020 deaths) : 83,429 (2015 same period deaths) = 1.09
Here the difference is just 9%! A pandemic so devastating that it generates a 9% increase in mortality!
At this point, I asked myself: but if we compare the 41-day period (February 20–March 31) of 2020 with any other 41-day period, would 2020 still come out with a higher number of deaths?
If not, the exceptional nature of this central period of the alleged 2020 pandemic would be completely canceled out. Let’s take, for example, the period January 1–February 10 (41-day period) in 2019 and 2017.
2019 January = 68,209
February = 59,876 : 28 x 10 = 21,384;
68,209 + 21,384 = 89,593
So in 2019, there were 89,593 deaths in a 41-day period just like the one chosen by ISTAT for 2020, a number just 11.5% lower than 2020’s.
2017 January = 75,623
February = 58,224 : 28 x 10 = 20,794;
75,623 + 20,794 = 96,417
So in 2017, there were thus, in [a period like the one] chosen by ISTAT [for] 2020, [more deaths by] 6% compared to the ISTAT number for the peak of the 2020 pandemic! In 2017 we had a winter period with 6% more deaths than the period of the worst pandemic in history, since the Spanish flu (that’s what they tell us)! And in 2017 no one thought of shutting down the world!
This closes the issue: the number of deaths in the 2020 crisis is absolutely [within the] media [average], and therefore there was no pandemic.
What becomes very clear to me is that you can't trust the science because the science can be fudged. They can manipulate the numbers to prove anything. You have to be able to trust the scientist and even they can make mistakes. First law of science if to question everything until it meets your own standards of logic.
Leslie
Good share again Renee!